Solar Eclipse Temperature And Light Intensity Measurement

Introduction
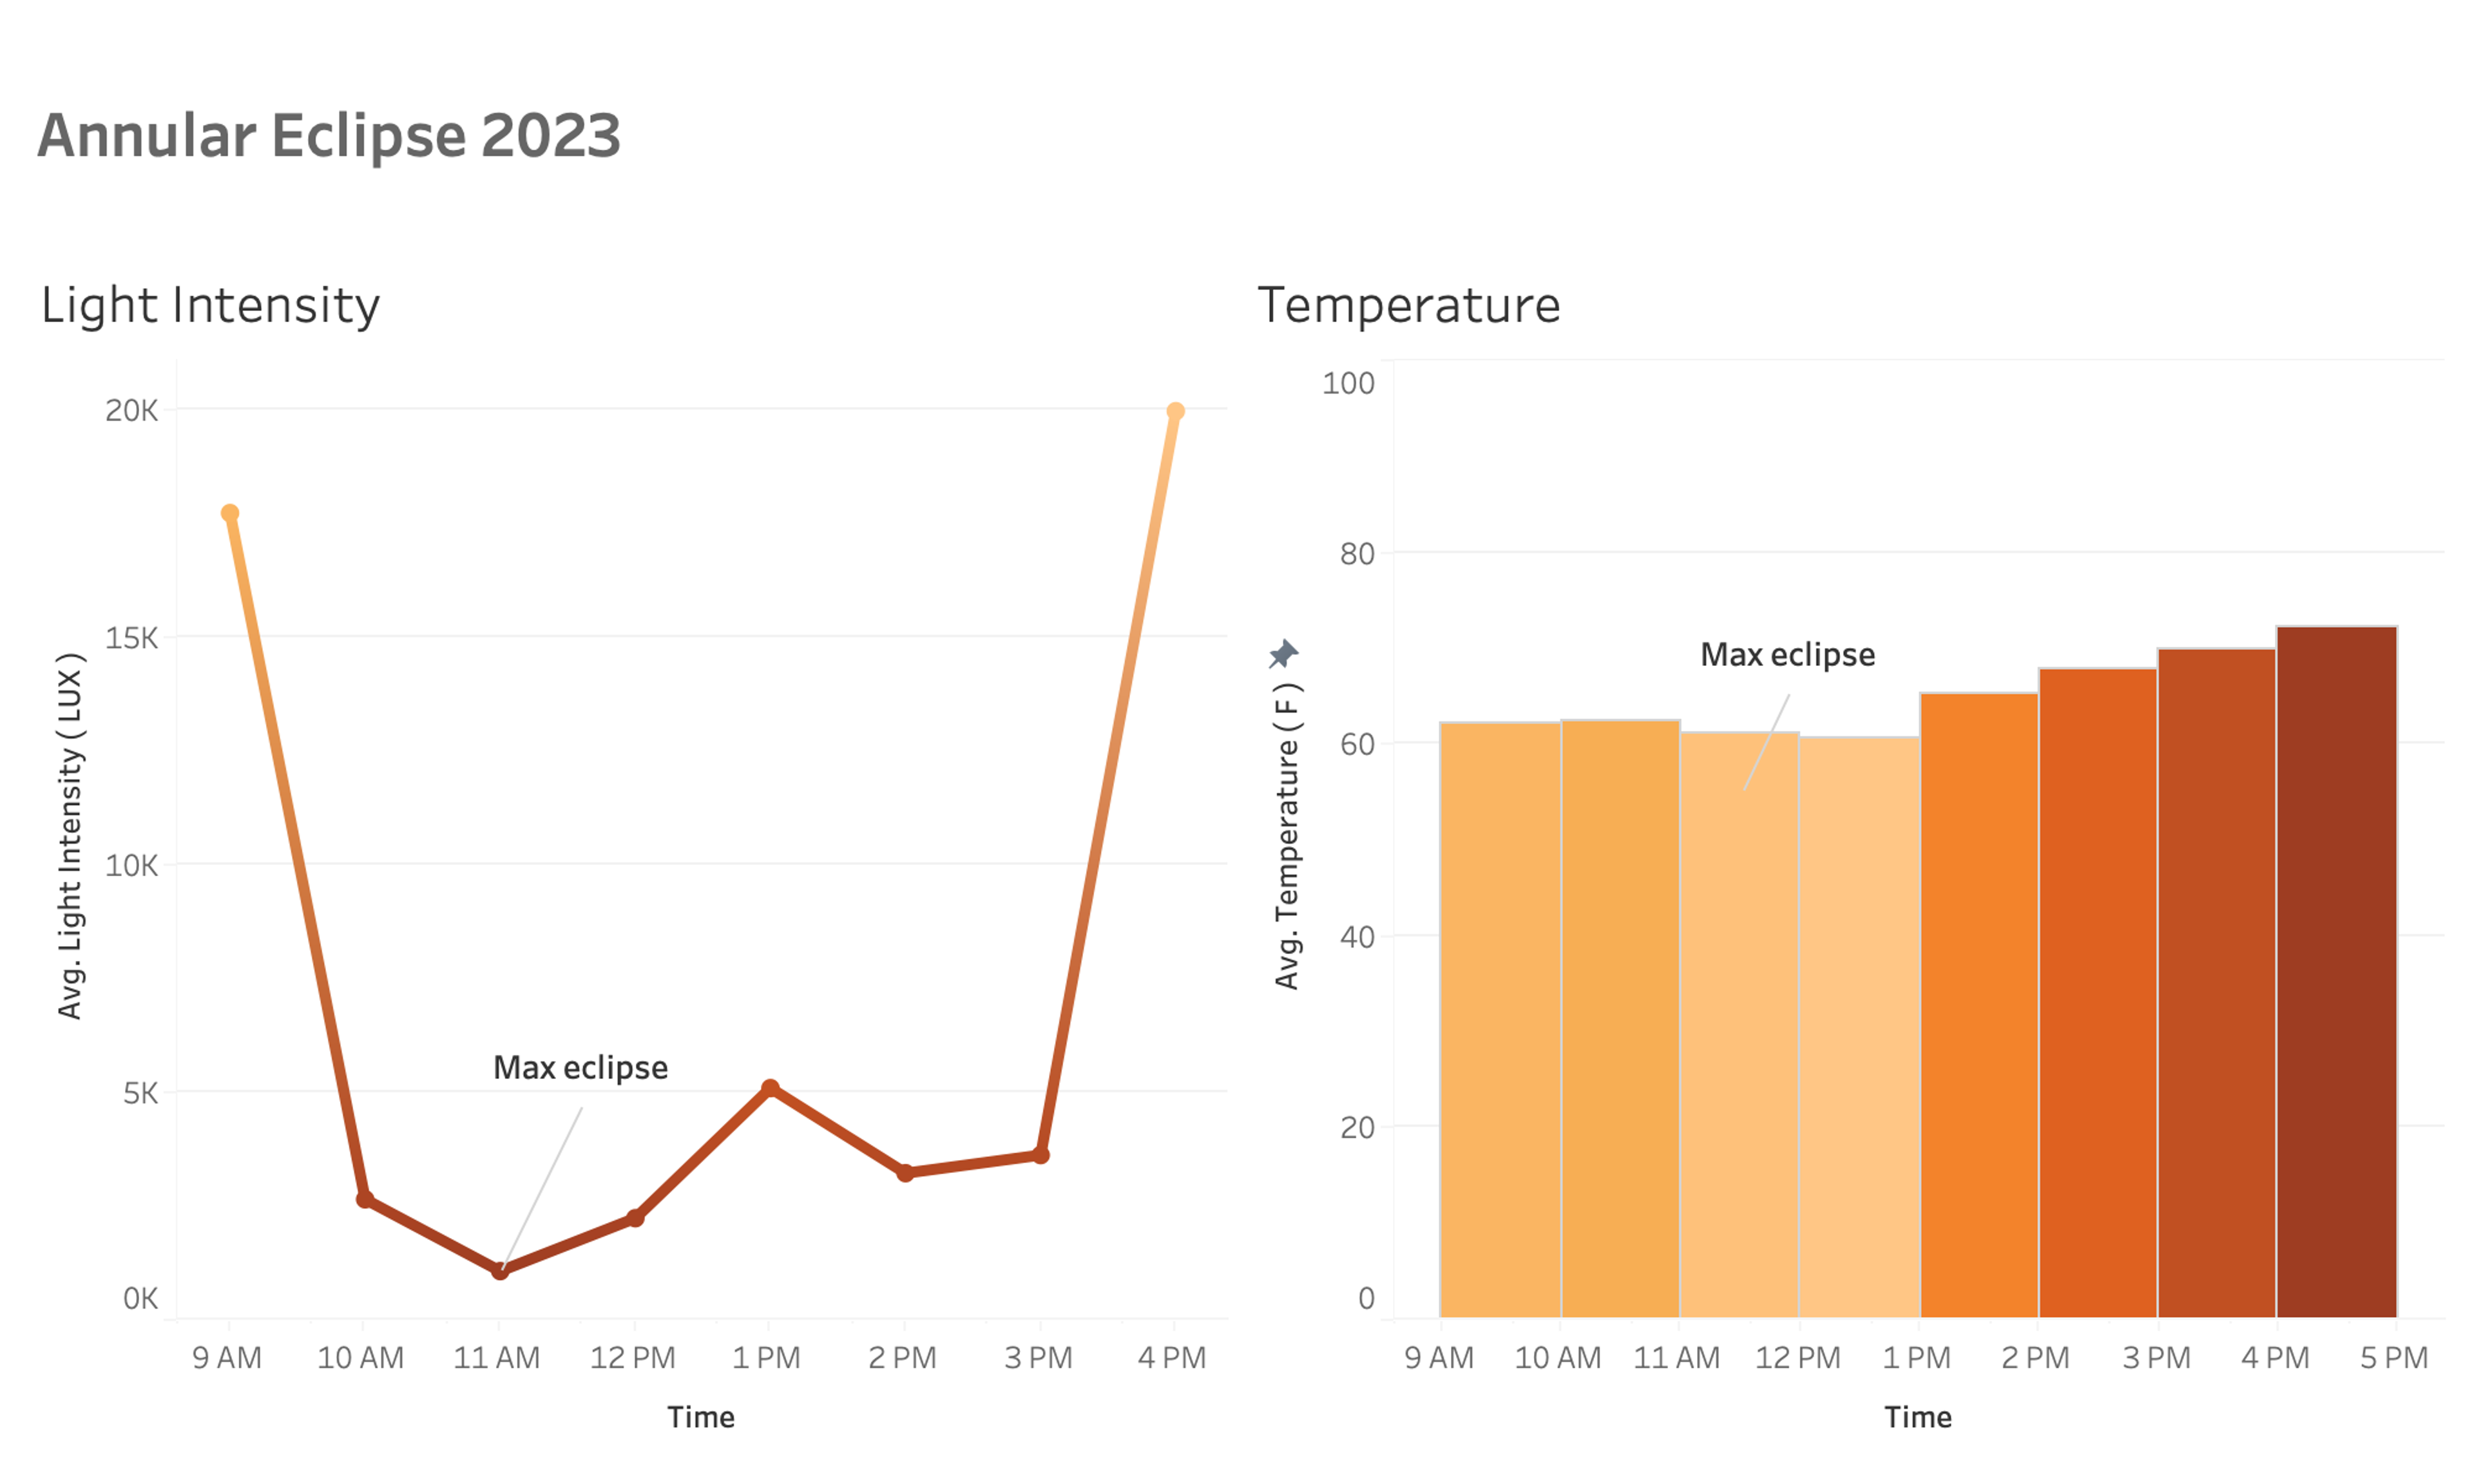
In 2023, I tracked temperature fluctuations during the annular eclipse using an Acurite Atlas weather station, showing a sight temperature drop corresponding with decreased light intensity during the max of the eclipse.

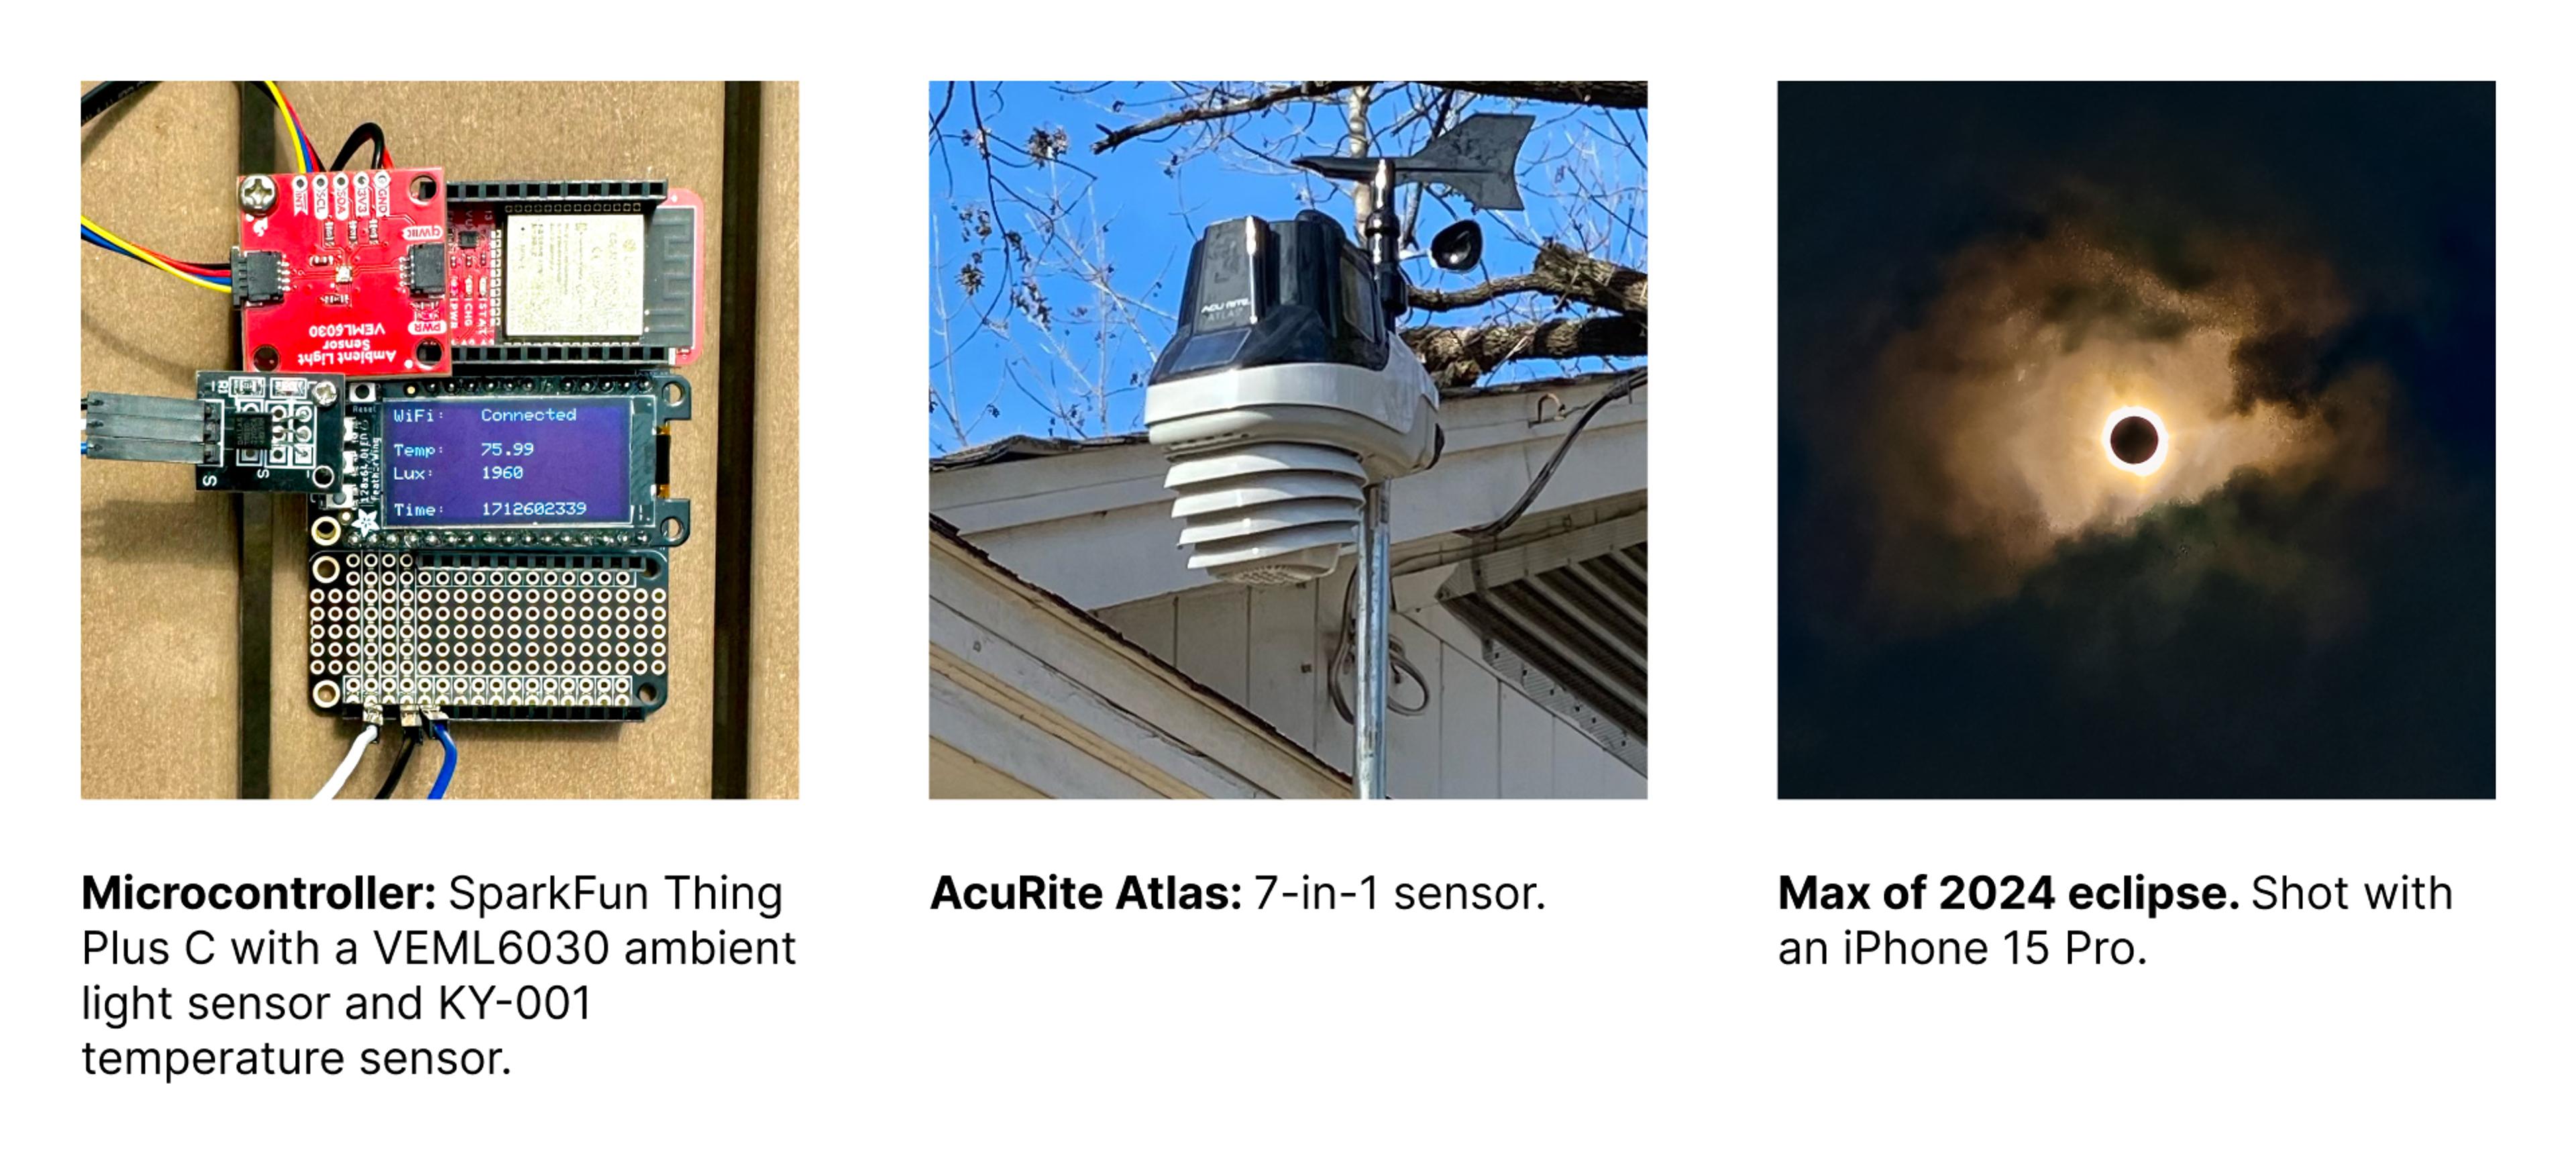
During the 2024 total eclipse, I captured the same measurements using both AcuRite Atlas from the prior year and a microcontroller fixed with a temperature sensor and ambient light sensor. I was also interested to see if temperature is impacted to a greater extent during a total eclipse versus an annular eclipse.

Analysis
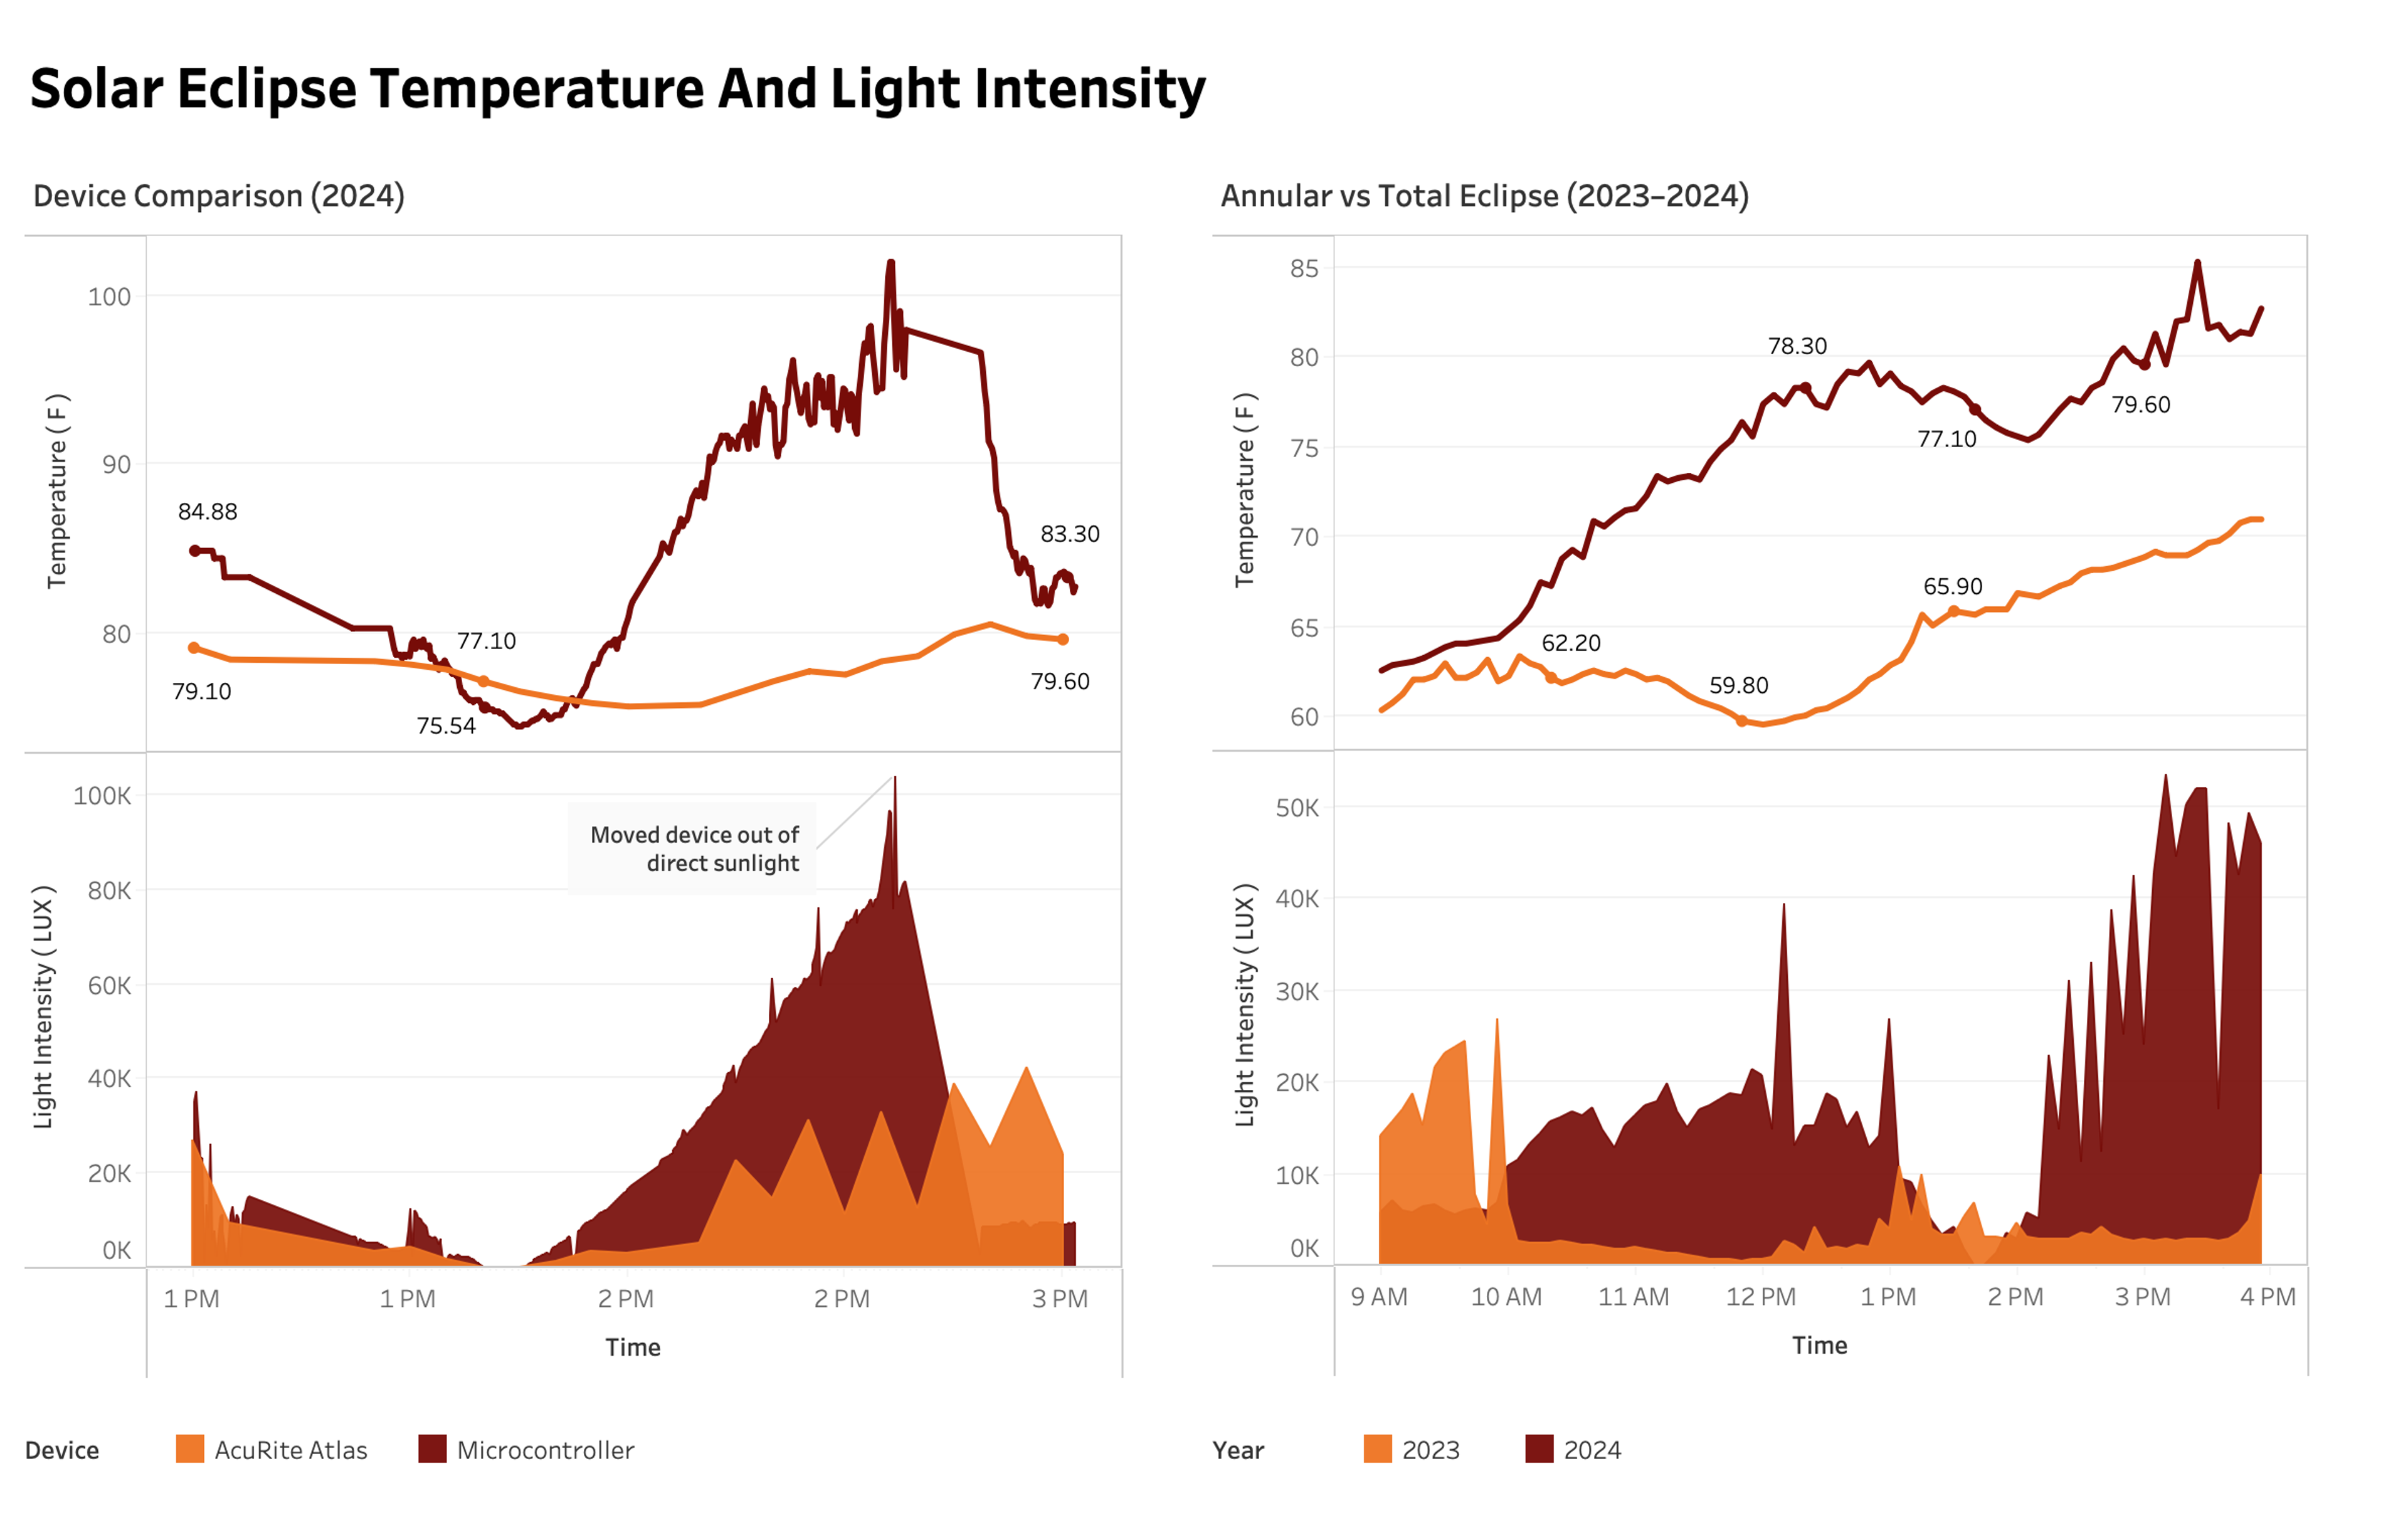
Predictably, the temperature dropped during the eclipse and rose shortly after the eclipse max. The microcontroller setup showed more variation in measurements than the Acurite Atlas, but recorded a similar relationship between ambient light and temperature during the eclipse.
I also compared measurements between the 2023 annular eclipse and 2024 total eclipse. Interestingly, the temperature only fell ~0.3 degrees lower between the start and max of the total eclipse than it did during the same interval of the annular eclipse.

You can view the interactive charts here.
Visualization
I used the data to create an animated visualization of changes in light intensity during the eclipse. In Adobe After Effects, the LUX values at each recorded interval modify the opacity of a stock image of the sun. A black circle moves across the sun to indicate the approximate position of the moon at that moment during the eclipse. During the eclipse max, the moon is centered over the sun image and the LUX drops to a value of 1.


